Replaying the NFL Championships with Twitter Language Analytics

2 min read
Last year we posted a popular piece offering our view on defining the characteristics of a data scientist. Perhaps we should have added to that the quality: “during the NFL playoffs, they have one hand in the chips-n-dip and the other typing away in an Emacs terminal.”
OK well it may not describe all data scientists, but at least some of ours couldn’t resist the opportunity to analyze the gridiron action with code. Specifically in this case they applied language analysis algorithms to study tweets being exchanged during yesterday’s NFC and AFC championship games. We occasionally tests its code on Twitter data, and we recently wrote about another example studying weather patterns.
Someone always pipes up to ask “why do you bother with this analysis?” Simply, Twitter offers a good source of high velocity un-polished language. Training natural language algorithms on polished prose like books is a very poor simulation of the types of free text we often encounter in our analysis (e.g., e-mails and free response fields within systems). Flexing our analytics muscles on a variety of problems helps ensure we can deliver the best results for our clients on actual business problems. For example, in one recent project we use natural language algorithms to scan through free-text communications contained within millions of IT incident tickets. Our client needed to study the occurrence of issues not currently captured with the pre-defined reporting categories. By sifting through all this data we were able to rapidly and accurately mine the free-text data to report on the previously un-reportable.
Enough, talk… let’s take a look at some of the data captured yesterday:
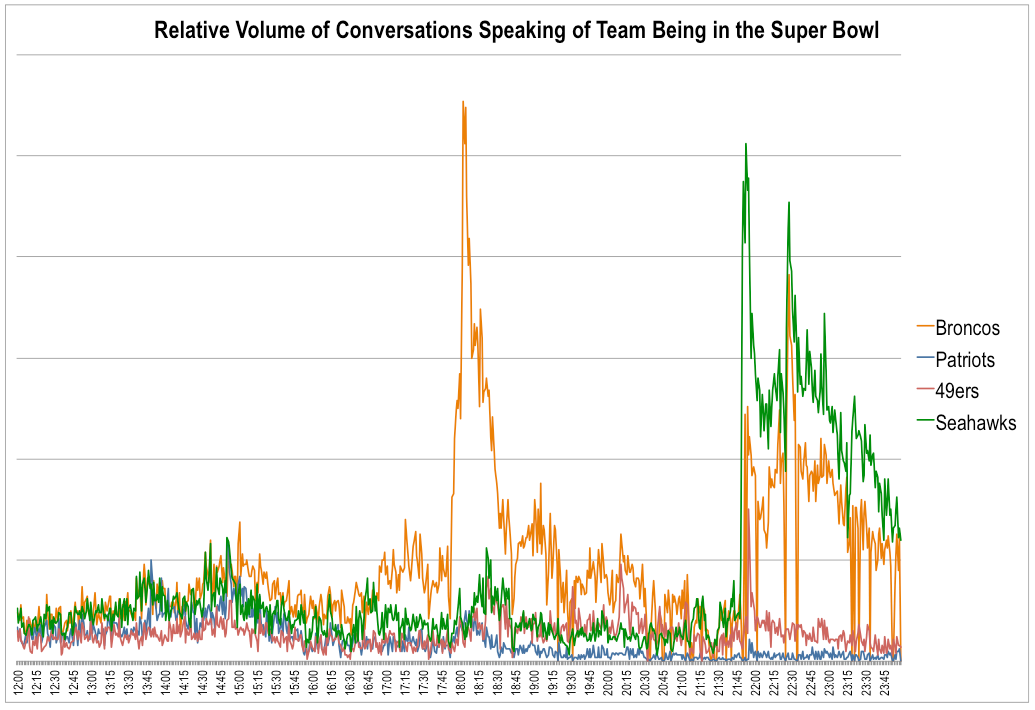
Yesterday was all about determining who will play in the Super Bowl two weeks from now. In studying conversations throughout the day the evolution of that matchup becomes quickly apparent. The chart below looks at the relative volume of chatter by team discussing that team and chances of playing in the Super Bowl (times in EST for Sunday January 20th). Following the AFC Championship game, we see a big spike in activity for the victorious Denver Broncos. That chatter then calms down as everyone settled in for the NFC game to determining the Broncos’ opponents. When the Seattle Seahawks emerged victorious shortly before 10 PM eastern time the Super Bowl chatter erupted again for both the Broncos and the Seahawks.
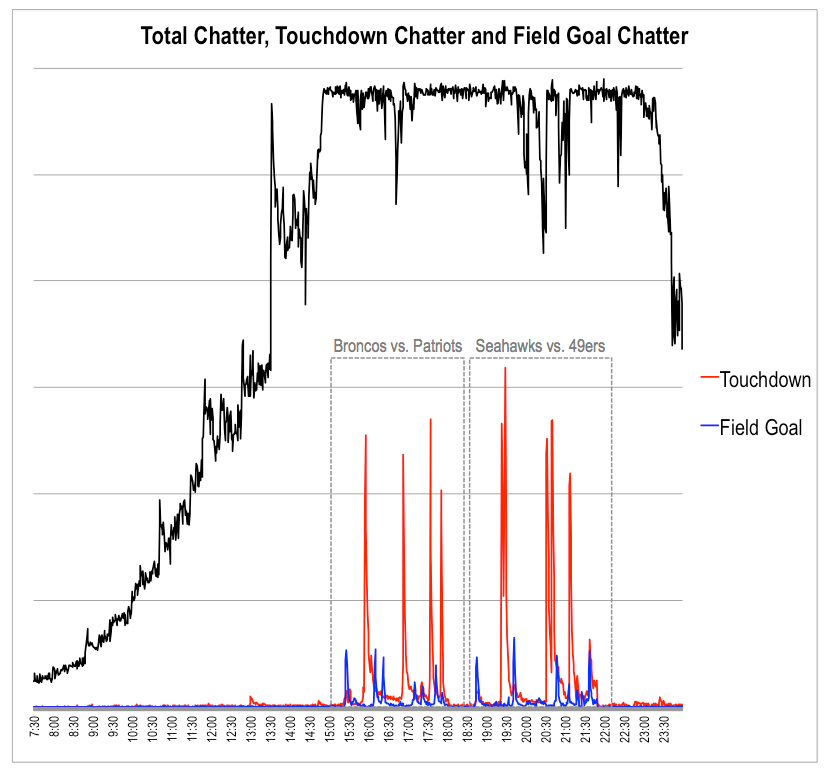
Within all this game chatter there’s a lot more detail than can be teased out. By searching conversations for comments indicating that a scoring event took place, we plotted the occurrence of ‘touchdown’ and ‘field goal’ events relative to overall chatter about the playoffs. The chart below shows this view for both games. Note that the total chatter plot maxes out as our API stream of tweets hit max capacity. Not surpassingly, people get a lot more excited about touchdowns than field goals.
Reading across the chart, you can see the major scoring events in both games. For example, the box score for the Broncos v. Patriots game records 4 touchdowns and 5 field goals during the game. The peaks for these events are clear on the game timeline.
By tweaking the above scans a bit more, we can clearly see who scored during each of the touchdown events in the AFC Championship game. The chart below shows the touchdown peaks from above, but with an added layer of analysis to identify the subject of the touchdown event.

The team also looked at some other aspects including geographic differences in tweets across the country and sentiment analysis–who was happy and who was angry when teams scored. We’ll take a closer look at some of that analysis in the lead up to the Super Bowl.