Data Preparation for Process Mining – Part I: Human vs. Machine

6 min read
This article first appeared as a guest post on Flux Capacitor, the company weblog of Fluxicon. The original post can be found here.
Data Preparation for Process Mining
This is the first in a four-part series on best practices in data preparation for process mining analytics. While it may be tempting to launch right into extensive analytics as soon as the raw data arrives, doing so without appropriate preparation will likely cause many headaches later. In the worst case, results could be false or have little relevance to real-world activities.
This series won’t cover every possible angle or issue, but it will focus on a broad range of practical advice derived from successful process mining projects. The 4 pieces in this series are:
- Human vs. Machine – Understanding the unintentional influence that people, processes and systems can have on raw event log data
- Are we on time? – Working with timestamps in event logs (spoiler alert: UTC is your friend)
- Are we seeing the whole picture? – Linking sub-process and other relevant contextual data into event logs
- Real data isn’t picture perfect – Missing data, changing step names and new software versions are just a few of the things that can wreak havoc on a process mining dataset… we’ll discuss weathering the storm
Part I: Human vs. Machine
Whenever we launch into a process mining project, our teams first identify and collect all the available log data from all the relevant event tracking and management systems. (We also aim to collect a lot of additional tangential data, but I’ll talk about that more in a subsequent post).
After loading the data into our analytical environment, but before diving into the analysis, we first closely scrutinize the event logs against the people, systems and processes these logs are meant to represent.
Just because the process manual says there are 10 steps doesn’t mean there are 10 steps in the event log. Even subtler, and potentially more dangerous from an analytical standpoint, is the fact that just because an event was recorded in the event log doesn’t mean that it translates into a meaningful process action in reality.
We consider this event log scrutiny one of the most important preparations for process mining. Failure to give this step a team’s full attention, and adjust processing mining approaches based on the outcome of this review, can quickly lead to misleading or just flat out wrong analytical conclusions.
We could write a whole book on all these different issues we’ve encountered, but below is a summary of some of the more common items we come across and things that anyone doing process mining is likely to encounter.
Examples
Pseudo Ping-Pong
Within process mining output, we often refer to a loopback between two steps as ‘ping-pong’ behavior. Such behavior within a process is usually undesirable and can represent cases of re-work or an over-specialization of duties amongst teams completing a process. However, to avoid mis-identifying such inefficiencies a detailed understanding of how people, process and systems interrelate is necessary before launching into the analysis.
Take the following example on IT incident management tickets as illustrated in Figure 1:
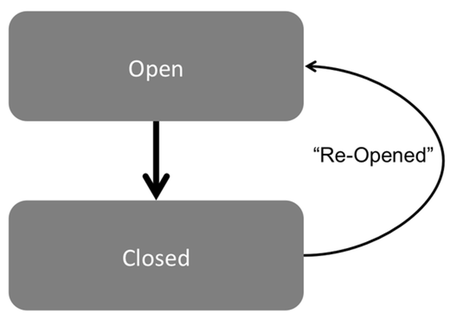
Figure 1: A closed ticket that is re-opened and then re-closed is an example of ping-pong behavior.
In this case a ticket is closed, but then at a later date the status is changed back to opened and then closed again. Many would quickly make a hypothesis that the re-opening of the ticket was a result of the original issue not being correctly resolved. Indeed this is a common issue, often caused by support staff placed under pressure to meet overly simplistic key performance indicators (KPIs) that push for targets on the time to close a ticket, but that don’t also measure the quality or completeness of the work output.
During one recent project our team was investigating just such a scenario. However, because they had done the appropriate due diligence up front in investigation how people interacted with the process management systems they also understood that there were some more benign behaviors that could produce the same event log pattern. We identified cases of ticket’s being re-opened and plotted the distribution of the time the ticket remained re-opened. The result (shown illustratively in Figure 2) revealed that there were two distinct distributions—one where the re-open period was very brief and another with a much longer period of hours or days).
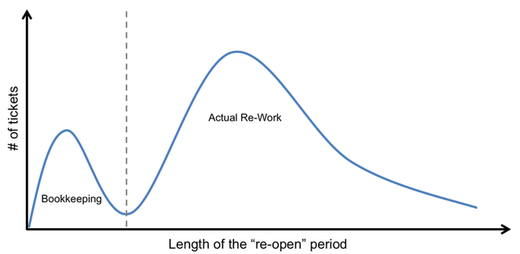
Figure 2: Distribution of the number of tickets relative to the length of the ticket’s re-open period.
Upon closer inspection we found that the brief re-open period was dominated by bookkeeping activities and was an unintended by-product of some nuances in the way that the ticketing system worked. Occasionally managers, or those that worked on the ticket, would need to update records on a previously closed ticket (e.g., to place the ticket into the correct issue or resolution category for reporting). However, once a ticket was ‘closed’ the system no longer allowed any changes to the ticket record. To get around this, system users would re-open the ticket, make the bookkeeping update to the record, and then re-close the ticket—often just a few seconds later.
Strictly from a process standpoint this represented a ping-pong, and still a potential inefficiency, but very different from the type of re-work we were looking for. By understanding how human interaction with the process system was actually creating the event logs we were able to proactively adjust our analytics to segment these bookkeeping cases within the analytics—in this case through a combination of the length of the re-opened period and some free text comments on the tickets.
After performing the re-work analysis exclusive of bookkeeping activities, the team was able to identify and quantify major inefficiencies that were impacting productivity. In one particular case, almost a quarter of the ticket transfers between two teams were unnecessary, yet had repeatedly escalated into ping-pongs due to unclear ownership of particular roles, responsibilities and functions within that support organization.
Figure 3 highlights some other event log anomalies that can be caused by the way people and processes interact with the system generating the log files.
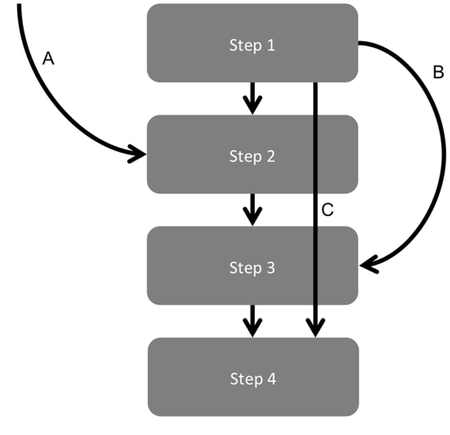
Figure 3: Examples of additional types of event log anomalies that can be caused by the way people interact with systems.
Event logs often show processes that do not start at the intended start point. It’s important to understand up front if this is an accurate representation of reality, or a quirk of how data is being recorded in the event logs.
An example of this can be found in loan processing protocols. The normal procedure might be that a loan request is originated and supporting documents added to the record before being sent off for the first found of document review. However, process mining may show that some loans skip this first step and their first appearance in the system is at the document review stage.
In this example, reasons for such observations could include:
- Loans from certain offices originate in a legacy system that then only creates a record in the main system starting at step 2
- Some special loans are still handled manually and passed off for document review without first logging an entry in the central system so the first record in this system starts at step 2
- Some loan requests are actually split into sub-requests during step 1, but some users forget to update child records with the parent request number making it appear like these child load requests start at step 2
If something similar is occurring in your process dataset, it is important to make sure that any analysis considers that the raw event logs around this point in the process give incomplete information relative to what’s happening in reality. Event logs often only record what’s happening directly within the system creating the log, while the process under study may also be creating data in other locations. There are some ways to fill in these missing gaps or otherwise adjust the analysis accordingly, which we’ll discuss in a later article.
B – Skipping Steps
Process logs also often skip steps. Analysis of such scenarios is often desirable because it can highlight deviations from standard procedure. However, the absence of a step in the event log doesn’t mean the step didn’t happen.
Returning to the earlier example of support desk tickets, teams that aren’t disciplined in keeping ticket records up to date will sometimes abandon a ticket, record for a period, and then return at a later date to close out the ticket. This is another example of a behavior that’s often caused by an imbalanced focus on narrow KPIs (e.g., focusing too much on the time to close a ticket can cause teams to be very quick at closing tickets, but not recording much about what happened between opening and closure). A ticket may be ‘created’ but never ‘assigned’ or ‘in progress,’ instead jumping right to ‘closed.’ This course of action can occasionally be legitimate (e.g., in cases where a ticket is opened accidently and then immediately closed), but before performing analysis it’s important to understand when and why the data shows such anomalies.
If this is the first time a dataset has been used to conduct process mining there’s a good chance that it will contain such regions of missing or thin data. Often, management teams are unaware that such gaps exist within the data and one of the most beneficial outputs of initial process analytics can be the identification of such gaps to improve the quality and quantity of data available for future ongoing analysis.
C – Rapidly Progressing Through Steps
Related to the previous case are situations where a process quickly skips through a number of steps at a speed that is inconsistent with what’s expected. Some systems will not allow steps to be skipped and thus users looking to jump an item ahead are forced to quickly cycle through multiple statues in quick succession.
Such rapid cycling through steps is often legitimate, such as when a system completes a series of automation steps.
Final Note on KPIs
At several points through this piece I mentioned KPIs and the impact they can have on how people complete processes and use systems. It’s also important to be on the lookout for how some of the observed differences between reality and event logs can have unintended impacts on such KPIs. Specifically, is the KPI actually even measuring what it’s marketed as measuring? There will always be some outliers, but given that many process KPIs were created without conducting thorough process mining beforehand it’s often the case that a process miner will find some KPIs that are based on flawed calculations—especially where a simple metric like average or median is masking a complex scenario where significant subset of the measurements are not relevant to the ‘performance’ intended to be measured.
Checklist for Success
In closing, here are a few key questions to ask yourself before launching into analysis:
- Do you understand how the event logs are generated, and specifically how humans and automated processes impact what’s recorded in the event log?
- For any anomalies revealed during initial process mining, do you understand all the actual actions that cause the observed phenomena?
- Are there any currently deployed KPIs that could be adversely impacted by the observed differences between the event logs and reality?
In the next installment of this series we’ll take a closer look at timestamps and some of the import relationships between timestamps and event logs.