4 Cases of Tangible Business Impact for ACME’s Service Desk Operations

5 min read
(* client name changed for privacy purposes)
TL; DR
Our tried and tested approach has saved service level penalties, improved customer satisfaction, prevented self-inflicted pains, and eliminated 50% of incoming work. The four cases highlighted below are specific examples of how we were able to help advance our client’s service operations with concrete tangible results. All of these analyses can be run using data already being generated in your organization with minimal interruption to your workforce.
Contact us to explore the ways we could impact your Service Operations/Call Centers.
CONTACT: Joe Malone, Chief Revenue Officer
M: +1 215 888 3224
E: joe@ckmanalytix.com
W: www.ckmanalytix.com
1. Re-tuning a call center to align capacity with demand
Service desks managers are continually striking a balance between costs and service levels. The staffing plan is at the crux of that balance of having the right number of agents with the right mix of skills to deliver against service levels all the time. Desks must also maintain an appropriate buffer to cover for uncertainties while delivering at the lowest cost possible.
For ACME, a ‘traffic wave’ of backlog calls quickly developed consistently every Monday between 7 am and 2 pm. The traffic wave would drive the speed of answer to a peak of 160 seconds and a daily average of 60 seconds, causing poor service quality to clients.
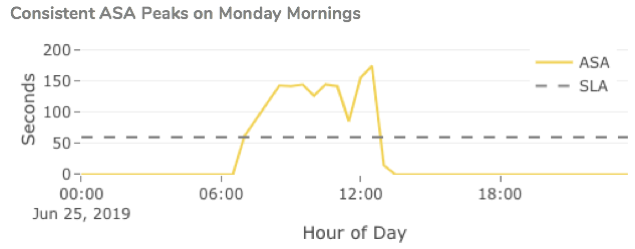
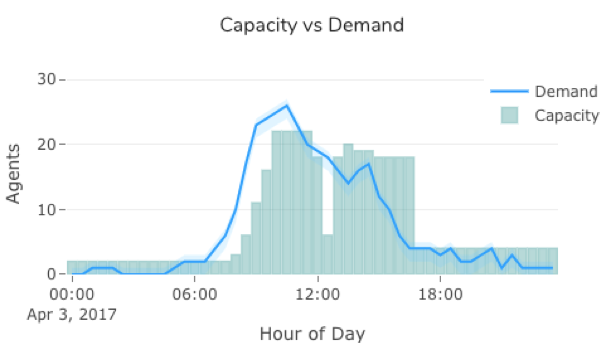
Comparing the capacity with the demand using our algorithms gave strong reason to believe the root cause was a capacity mismatch. In the mornings, there is a constant gap between demand and actual capacity with staffing ramping up too slowly to meet the rise in demand. Furthermore, during lunchtimes, there was a definite dip in capacity. Our algorithms identified these discrepancies as a systematic supply-demand mismatch and not just a momentary spike in demand.
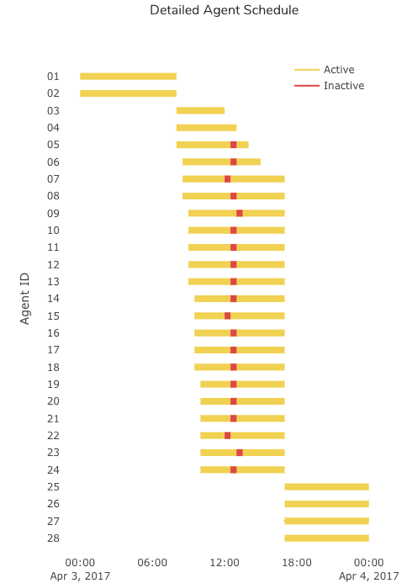
Drilling in more-in-depth on the lunch pattern, we could see that the agents’ lunchtimes were all planned for the same timeslot, causing the dip in capacity.
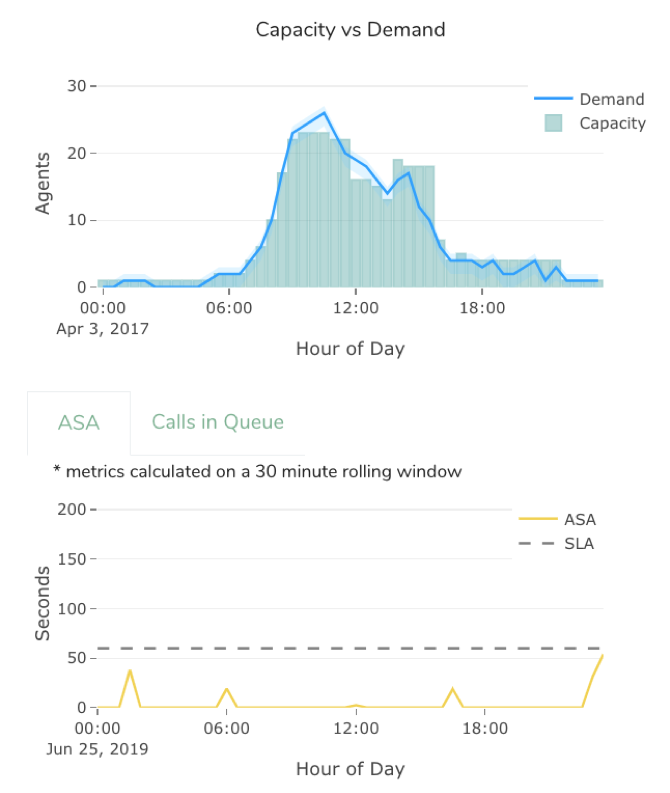
ACME re-tuned their staffing plans and quickly reduced their average speed of answer from 60 to 5 seconds, comfortably meeting SLAs without adding additional staff.
2. Uncovering process inefficiencies to drive SLA performance improvement
ACME was struggling with incident resolution times for one of their accounts. This translated into extended client downtimes and reduced productivity. ACME was also being penalized with costly service level credits for not meeting the service level agreement.
We looked at this issue from a process standpoint by digitally reconstructing how work happens within the company to detect if there are any noticeable sources for waste. This approach provides a complete and factual data-driven window into processes that can not be replicated with the traditional interviews or spot-check techniques. Our process mining algorithms analyzed the ticketing data and discovered the areas of waste. For instance, the Customer Software Installs had an acute case of ping-pong: Service Desks level 1 and level 2 were pushing tickets back and forth between them, increasing the time to resolve.
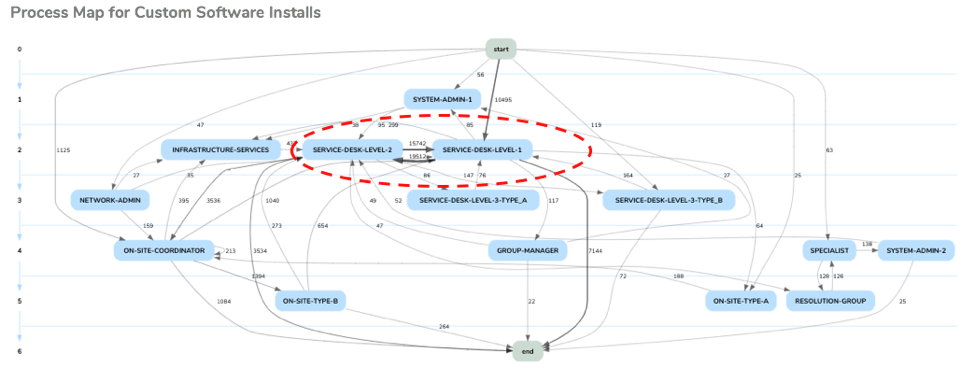
Detailed analytics revealed which agents were contributing to this ping-pong activity, which in turn guided targeted re-training efforts across the organization. Using these data-driven insights, teams re-aligned into a more efficient process end to end, as seen below:
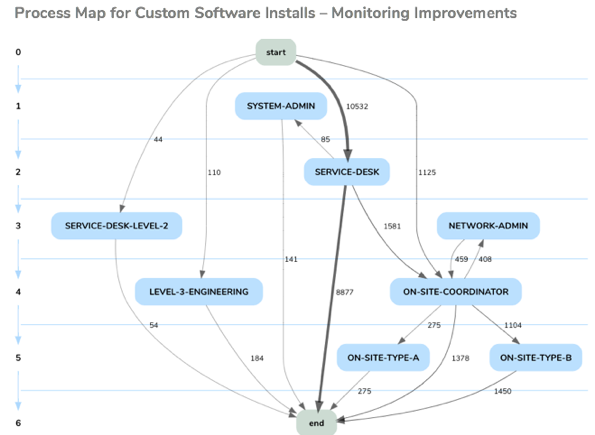
The final streamlined process allowed delivering quality solutions within the service level agreement. This methodology was repeated on multiple processes and workgroups, finally allowing the account to comply with their overall MTTR service level agreements. Prior to our analysis each group only looked at metrics relative to their own performance, but our process analytics helped everyone see the bigger picture and the importance of more clearly communicating on end-to-end process management. This fundamentally changed the culture of how work was managed for the better.
3. Mitigating Self-Inflicted Pains on the Service Desk
Another service desk at ACME would suffer from massive waves of calls waiting to be answered. This pattern happened frequently but at different times of the day. During each of these waves, the long queues would impact the average speed of answer, and clients would complain about long waiting times.
We used our capacity algorithm to analyze the number of active agents at the onset of periods of long queues. The hypothesis became clear: too many agents were going offline at once, impacting the backlog and ASA during busy periods. Although these periods of reduced staffing were often brief, the ‘traffic wave’ that developed took a long time to clear and led to a significant reduction in key performance metrics.
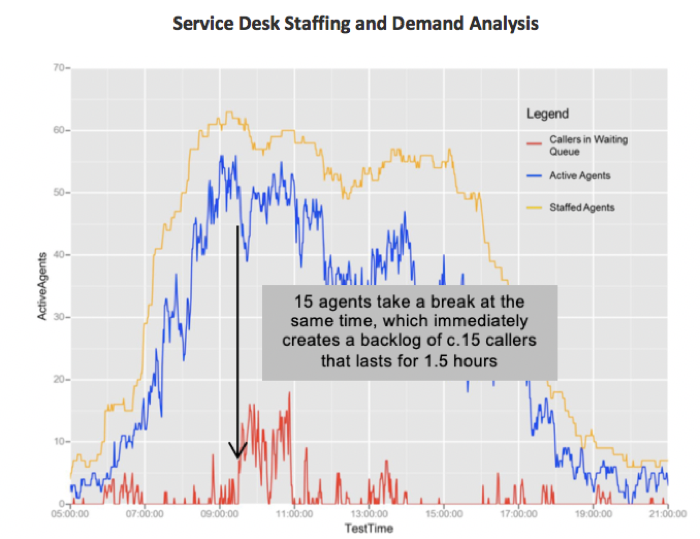
Prior to our analytics, management did not have a full appreciation for the severe impact a brief blip in staffing could have on desk performance. The account leadership reviewed the insights and educated critical players on the impacts observed. The staffing patterns were adjusted and the backlog waves stopped happening. ACME met the overall SLA, and customer satisfaction surveys confirmed this service improvement.
4. Eliminating unnecessary work across the operation
Work elimination is always our first step when engaging in operational efficiency efforts. We explain at length why in this other post.
Discovering areas of highly repetitive work is a fruitful source for work elimination. Repetitive work usually has a focused root cause; therefore, the ROI of solutions is likely to be interesting.
One of our core algorithms uses natural language processing and clustering to sift through all the operational data and finds work that is likely repetitive. We informally call it our Whack-a-Mole (WAM) model, alluding to the classic arcade game where the player must tirelessly whack the same 9 moles with a hammer to gain points. In the most noticeable case, the WAM algorithm flagged 60% of the work in a workgroup as repetitive. This was consistent over time.
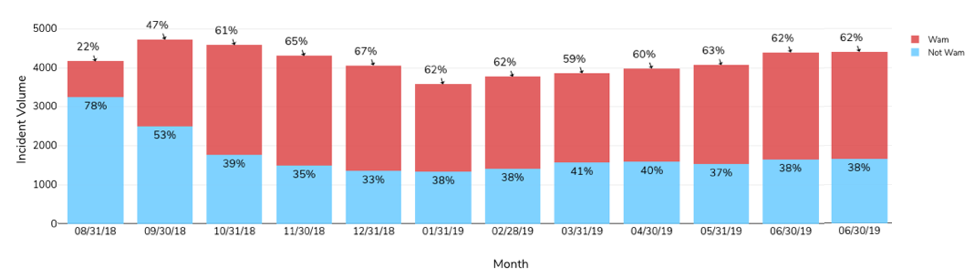
The existing management dashboards at ACME were reporting this scope of work as high quality and completed within SLA. The incidents were resolved properly and were completed within SLA, but all this effort and costs could have been avoided entirely. Such repetitive break-fixes also represent a significant risk to the business as such instability in the environment can quickly cause much bigger problems.
With the repetitive work identified, the next step was to drill down to identify candidates for elimination. Such insights guide efforts by the Problem Management team in finding root causes, devising solution methods, estimating ROI, and informing decision-makers.
Our clustering algorithm showed that a sizeable amount of repetitive work was found around reimaged VDI’s, login, and Excel issues, as seen below:
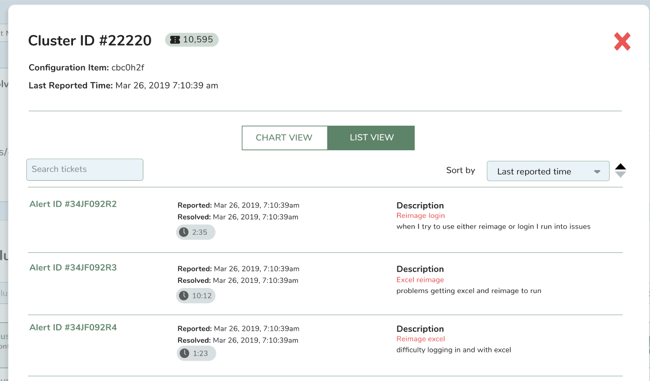
The algorithm identified more clusters of repetitive work that led to further root cause investigation. All of this allowed the Problem Management team to reach focus and successfully reduce the amount of work for this workgroup by 50%.
Contact us to explore the ways we could impact your Service Operations/Call Centers.
CONTACT: Joe Malone, Chief Revenue Officer
M: +1 215 888 3224
E: joe@ckmanalytix.com
W: www.ckmanalytix.com