Analyzing SQL queries with EXPLAIN ANALYZE and PEV2

2 min read
A CKM Developers’ Blog
How are SQL queries executed?
SQL is a declarative language – we specify the output that we want, rather than exactly how to obtain it. For instance, we might write a query to return the average age of people in different gender groups, rather than, say, writing a loop through each group, adding up the ages, and dividing the sum by the number of people.
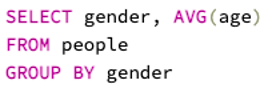
SQL, a declarative language
Query processors exist to take our declarative statements and convert them into a set of specific procedures to execute. This is an execution plan. There are likely many ways to execute a query, some more efficient than others. PostgreSQL’s planner/optimizer examines possible plans and selects one that it expects to run the fastest.
What is EXPLAIN ANALYZE?
We can obtain an execution plan for any SQL query by including EXPLAIN ANALYZE at the top of the query and hitting execute. Instead of returning the outputs of the query, PostgreSQL instead returns a plan detailing operations that were executed. This also includes several measurements, such as estimates on the number of rows affected (which demands CPU and memory resources) and actual execution time.
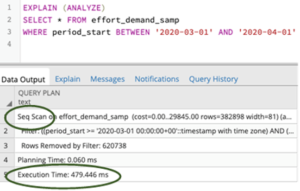
From the execution plan: a sequential scan was executed in 479 milliseconds
This plan might not be particularly interesting for a simple query, but for more complex queries, EXPLAIN ANALYZE is an invaluable tool that helps us break down the operation and find opportunities to improve performance. One problem, though, is that the default output is not always very easy to comprehend.
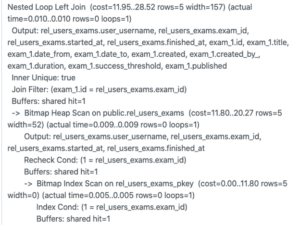
Help! A complex query, illustrated by a dense blob of text
What is PEV2?
Enter PEV2, short for Postgres Explain Visualizer 2. The open-source tool shows a graphical visualization of any PostgreSQL execution plan via a user-friendly interface.
Users can copy a raw execution plan from PostgreSQL, paste it into the tool, and in return see the plan as an interactive visualization that can be more easily combed through. The tool exists as a web application, but a serverless version can also be deployed for security and privacy reasons.
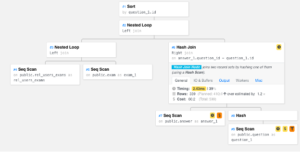
The same query, visualized by PEV2. Not so complex now.
Now, what can we do with this map? We can think of it as a sort of a process map, and take a look at what processes are happening, in which order. Each node contains helpful statistics about each operation, such as actual time taken to execute, expected costs (the planner’s initial estimation of how long that part of the query will take to run, measured in arbitrary units), and output columns. Alerts bring to attention relatively demanding steps — promising candidates for our evaluation.
By developing an understanding of what a query does and how it is executed, we can identify inefficient operations that serve as bottlenecks in complex queries:
- Are we carrying over unnecessary columns? Cleaning this up can reduce ambiguity and save space.
- Is there any opportunity to create indexes to facilitate faster access to data rows?
- Are there costly CTEs that overlap with other queries? Would it make sense to factor them out into a separate materialized view?
.. and so on.
Takeaway
Use EXPLAIN ANALYZE in conjunction with PEV2 to understand complex SQL queries and find opportunities to make them more efficient. At CKM, we’ve found this online course to be a great starting resource on query optimization.
We are always looking for Data Scientists and Developers to join our team! If interested, read more about us and apply here.
You may be interested in other technical blogs as part of this series:
Moving Conda Environments with conda-pack