Balancing Efficiency and Risk in Procure to Pay: Safely Realizing Cost Savings Using Process Mining Techniques

5 min read
At CKM we highly encourage participation in data science competitions, whether it be Kaggle or any other type of contest. We believe that competing helps us achieve the following as a firm:
- 1. Gauge our performance in a certain field/area against others in the industry.
- 2. Work on and learn about interesting data/techniques that we may not get to see in the normal course of business.
- 3. Learn from competitor submissions, and share our own work with the community.
2019 BPI Challenge Overview
We recently participated in the 2019 Business Process Intelligence Challenge in association with International Conference on Process Mining in 2019. We have participated in this competition for many years and previously won twice. The goal of the challenge was to analyze a dataset of SAP purchase orders belonging to a large multinational paint company, and to produce a report that would address the following high-level points:
- 1. Evaluate different processes and determine whether they can be grouped together in a certain way.
- 2. Assess throughput of various processes and determine whether certain events constitute bottlenecks, and how these might be remedied.
- 3. Determine whether there are any anomalies within the defined processes, and whether these anomalies can be attributed to certain features of the process (e.g. vendors, users, etc).
The dataset consisted of around a year’s worth of purchase orders that were broken out into individual line items, with an event log associated for each of these line items. In total there were ~1.6 million events distributed across ~250K cases.
Our Approach
One of the big challenges with this competition was the limited context around how the data was produced, in addition to the relatively open nature of the questions. Usually when performing “real life” data science, our teams have the opportunity to probe our clients for further explanations and contextualization of the problem at hand, as well as clarification on certain aspects of the data. This research phase allows us to ensure that the analyses we produce targets specifically defined problems afflicting the client. This unfortunately was not possible in the competition, so we had to get a little creative with our approach, outlined below.
- 1. Do the research. We enhanced our limited base knowledge through consulting with in-house and external subject matter experts around key aspects of the PO and invoice payment process. What are they? How do they work? What are common problems with the process? What systems are out there? What information is usually recorded? Getting answers to these types of questions would ensure we would not limit our understanding of the world from one specific data extract.
- 2. Look at the data through different lenses. The challenge prompt gave some direction as to which areas should be explored, but we believed that in order to be truly competitive, we would need to come up with a broader set of analyses that could zoom in on specific aspects of the data. Having built up some domain knowledge through our research allowed us to frame questions from the “client’s” perspective and allowed us to come up with creative analyses that focused on different aspects of the business.
- 3. Provide actionable insights. To the extent possible, we wanted to ensure that our analyses answered the “so what?” question. It is easy to get bogged down in slicing and dicing in a million different ways, but ultimately a concrete recommendation needs to come out for the analysis to have any impact. In instances where there was not quite enough information to make the recommendation, we tried to formulate a hypothesis using the data as a foundation and provided ideas about how to source the additional information needed.
Report Highlights
In this blog post we want highlight two analyses that we performed in the report. The first one looks at User Digital Footprint, and the second focuses on the Invoice to Payment process.
User Digital Footprint
The goal of the user digital footprint analysis is to discern any consistent patterns that may provide insight into how users are using the purchase order system and what type of activities they are performing. We highlight some of the key points below.
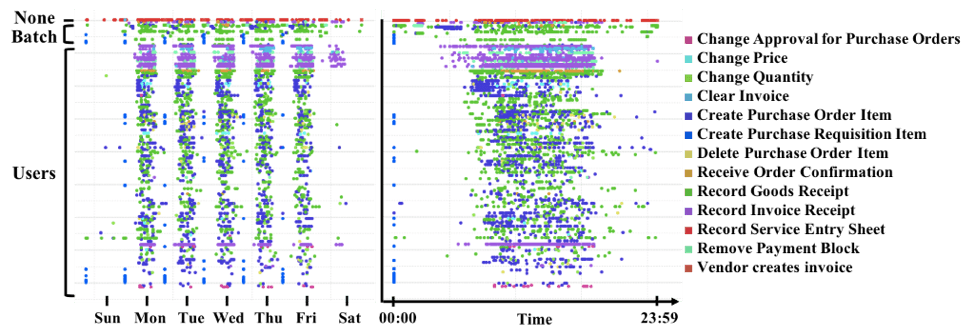
- User activity patterns reveal what users are working on throughout the day and week.
- Most users focus on one type of activity, but anomalies can be detected that warrant further investigation (e.g., a possible violation of segregation of duties resulting in a fraud risk).
- Automated batch users work around the clock: can similar human-handled activities be automated?
- Certain users performing specialized tasks can be a cause of bottlenecks (e.g., only two users appear to clear invoices and only during sporadic periods).
From these data insights we were then able to suggest a series of actionable steps to more consistently leverage automation technologies across the organization and streamline manual work to optimize processing steps. A further discussion of these points is contained within our full paper.
Invoice to Payment Analysis
One of the main findings from our report centered around how the company currently processes its invoices. By visualizing the intervals at which the company receives invoices from vendors and comparing it with when the invoices are paid, we were able to unearth a mismatch between the timing of these events and an opportunity to optimize the firm’s cash management practices.
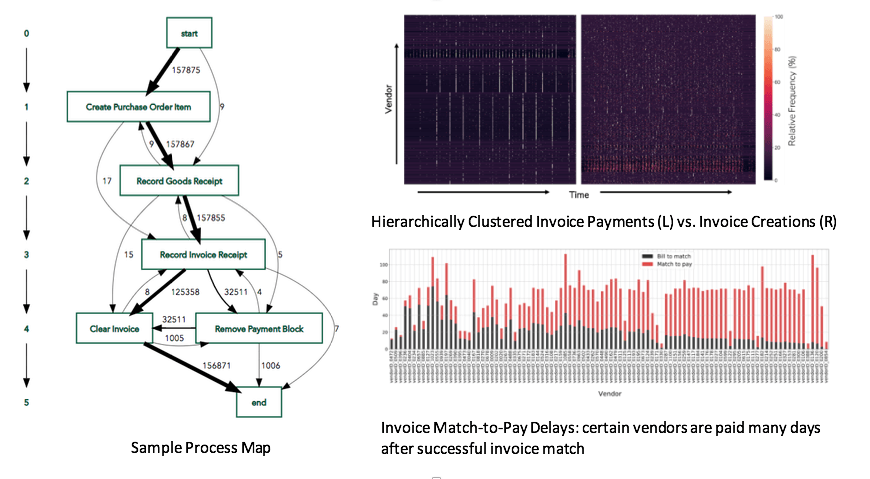
- The process map (left) shows the defining steps in the procurement process (the Vendor Creates Invoice step is actually not pictured in this chart, but it occurs between Create PO Item and Clear Invoice).
- The top right charts show that while invoices primarily come in without any specific pattern for the majority of vendors, the company pays them at fixed intervals, which is not optimal.
- Finally, we look at a breakdown between Bill to Match and Match to Pay for high value vendors (bottom right): we can see that there are a number of vendors where the match to pay time is the largest proportion of the total bill to pay process. There were many instances of ‘hurry up and wait’ with the pre-match processes (black) rapidly completing steps only for the invoice to be sent for payment much later. Those later payments also frequently occurred over inconsistent timeframes.
- The organization should decide on a clear cashflow policy (e.g., fast payment seeking an early payment discount or consistently slow but timely payment seeking to maximize cash on hand), but the data demonstrated that presently there is no consistent strategy driving the underlying review and payment processes.
Key Takeaways
The 2019 BPI Challenge provided us with an opportunity to explore a novel dataset and learn about a business process with which we had less experience. The open nature of the challenge forced us to go beyond simply using existing process mining tools to extract insights, and we were able to shed light on various aspects of the process through the use of custom analytics and visualizations as highlighted above. Upon finishing our report, we had numerous questions we would have loved to ask the company that produced the data. We know from experience that bringing in additional data from other sources can have a huge impact on the effectiveness of the overarching analysis. As we mention at the end of the report:
Organizations, especially complex ones, generate data in myriad ways. We believe that many of the findings in this report could be significantly enhanced by looking at other kinds of data produced by the subject company, such as employee rosters, inventory data, warehouse shipment delivery records, financial transactions, and even purchase order contracts with various vendors. Bringing disparate data sources together is a powerful way to gain a fuller understanding of what is actually happening within the enterprise at various levels.
This brief blog post only touches on some of the analysis contained within the full report, which you can find here.