Coffee Break Insights: It’s a Fire Hydrant Waterpark Kind of Day

2 min read
It’s a hot one out there. As the mercury rises WNYC, the New York Times and others frequently cite the cracking open of fire hydrants as a sign that summer has arrived in NYC.
While cooling off via fire hydrant can be done legally, rogue streetside waterparks are generally frowned upon by the city.
Over a quick coffee-break a few of our data scientists wondered how hot does it need to get before New Yorkers open up fire hydrants?
The answer, based upon an analysis of complaints to 311, appears to be 80-85F with most instances occurring in the late afternoon. Hardly a shocker, but nonetheless an amusing insight into how NYC’s digital footprint reveals nuanced details on the pulse of the city.
The raw 311 data contains many additional details including the location of the complaint. However, after polishing off the morning cup of coffee we were done with fire hydrants for the day and got back to project-related analytics.
Summary of the Analysis
In this first set of charts we look at the volume of daily 311 calls relative to the maximum temperature recorded that day in Central Park. Calls for both “Hydrant Running” and “Illegal Use of a Hydrant” markedly increase once the temperature reaches about 80 degrees F. The bottom chart shows the overall 311 call volume for all other calls and there is very little correlation with temperature apart from a slight increase in volume for colder temperatures.

Figure 1: Daily call volume vs. maximum temperature in Central Park (1 May 2010 – 15 July 2013).
While the call volume increases we see for these two subsets can be due to a number of causes, it’s a reasonable assumption that a sizable portion of this trend is related to those looking to cool off. To further analyze that assumption we looked at the typical time of day for “Illegal Use of a Hydrant” calls on ‘hot’ (max temperature >78 degrees F) and ‘normal’ days. On ‘hot’ days, calls about the fire hydrants significantly increase in the late afternoon during the warmest part of the day. On cooler days no such significant time-specific peak is observed.
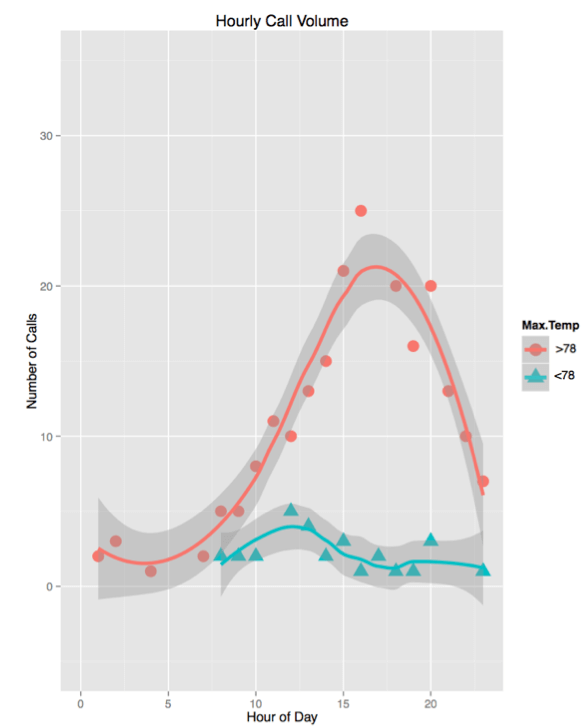
Figure 2: Calls for “Illegal Use of a Hydrant” by hour of day (1 May 2010 – 15 July 2013).
Data Sources
- 311 call data from NYC Open Data (nycopendata.socrata.com)
- Central Park temperature data from the National Weather Service (weather.gov)
- Analysis conducted for data between 1 May 2010 – 15 July 2013
About Coffee Break Insights
Coffee break insights are short and simple samples of digital analytics using publicly available data sources. The name comes from the fact that many of these charts and graphs are the result of informal “I wonder what…” conversations that occur around the CKM Advisors coffee bar. While the topics are often wholly unrelated to our consulting work, such simple results highlight the power of leveraging digital data for studying activities within complex organizations.