Process Mining Dimensions

4 min read
Operations should not only seek to minimize the handle times of required steps but also to eliminate superfluous ones, thereby reclaiming the efficiency of the teams and improving the quality of service to their employees and customers. In order to find and minimize waste in a business operational setting, the analyst and stake-holders must first establish some fundamental parameters of the analysis itself:
- How is work accomplished?
- Who executes the work?
- How is that represented in the systems that the team use?
Understanding the key measurable steps in a process is the first step to providing useful metrics and measured opportunities.
Here at CKM, we like to visualize these measurable steps with a process map, a kind of visual worldview of the flow of ticketed work whereby the user can clearly see non-conforming behavior. In this article, we will discuss how the structure of the process maps (and any resulting analysis) is sensitive to the fundamental questions: how, who, and why.
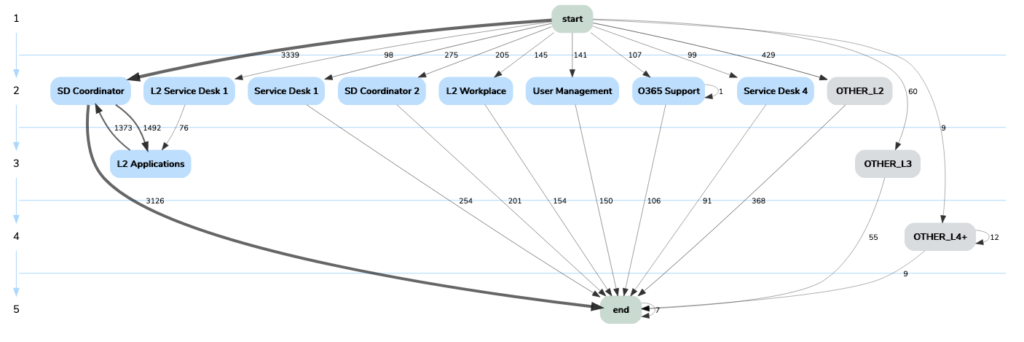
Assignment Groups: Route, Reroute, and Route Again
In the ITSM space, work is often structured into categories to which routing is applied to the correct resolving team. Systems like HPSM and ServiceNow allow you to structure groups of people who are adept at solving a specific problem. Work items pass through various groups of employees until the final resolving group accomplishes the work and marks it as resolved.
For example, a customer of the service company calls in to report an issue. Immediately, the service desk employee records the relevant information and attempts to resolve the user’s issue. In the event that an issue cannot be resolved and the issue requires further attention, the service desk attendant will hand off the workstation related incident to the relevant group. After some time, the group pulls the ticket off their queue and begins their work. In the event that the issue is improperly routed or additional information must be provided by another group, the item will get reassigned out. After some iteration, the ticket is eventually resolved by the group and agent best equipped to handle it.
In this example, the major structuring element of the organization’s workflow is assignment groups. In the absence of more granular, structured information, we would recommend the audit trail of assignment groups as the primary dimension along which the analyst will best discover insights into the quality of routing, loss of information, and general inefficiency. The relevant process map that results may look something like this:
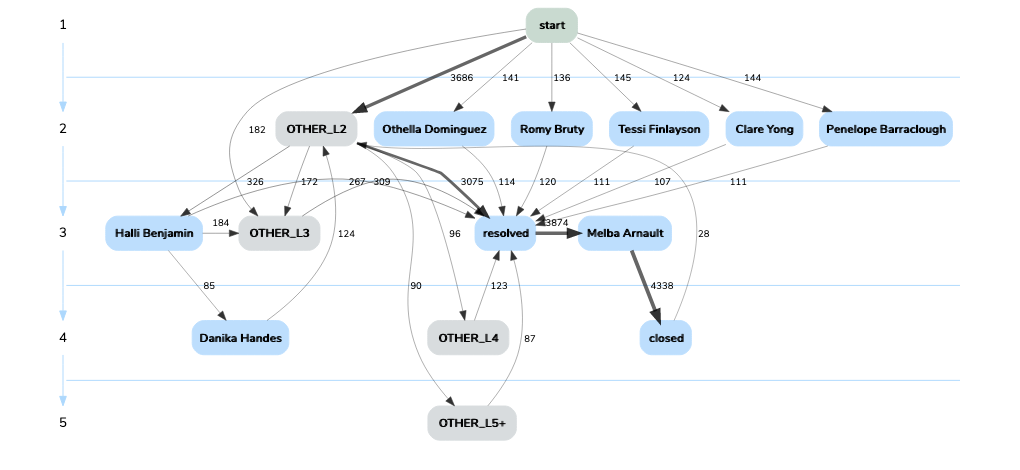
Individual Hand-off Data in Smaller, Fluid Operations
For a smaller operation that hasn’t adopted rigid and specialized assignment groups, the process often revolves around specific, specialized persons. We can slightly modify our approach to orient the process map generation around “submitters” and “agents”. That means the nodes of our map become the names of our agents and transitions highlight direct hand-offs between these people. Such a view becomes particularly useful when the intra-team dynamics of work item resolution are plagued by non-conforming behavior or when the assignments of items in the workflow system are themselves unreliable. With the help of a detailed audit log, we dispense with the unreliability, choosing instead to track the owners of changes in relation to work items. We, therefore, see exactly the cadence of agents who’ve worked on the items.
The One-Stop-Shop: Discovering End to End Inefficiencies
But what if the work never changes hands? In cases where one entity manages the workflow from end-to-end, examining routing from an assignment group perspective is rarely informative. In the context of staffing recruiting, for example, there may be just one recruiter in charge of carrying an application through the entire recruitment pipeline. A stakeholder’s goal here is not just identifying who is being inefficient, but also when these inefficiencies are occurring.
A more relevant and granular dimension to visualize would be the stages of the pipeline itself. This reimagines the structure of workflow as states in the process – from when an application is submitted to when a candidate is screened, interviewed, and ultimately hired or rejected:
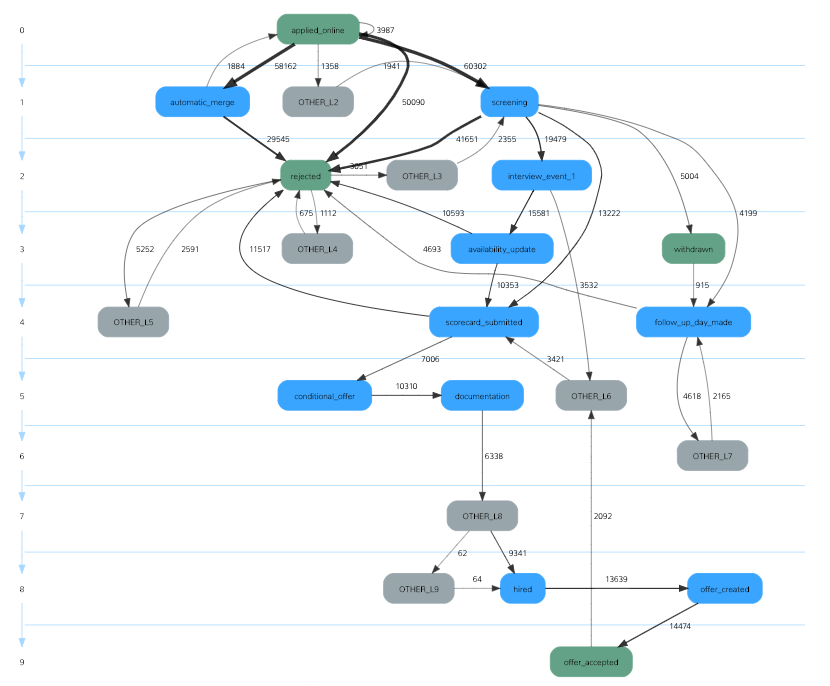
By blowing up a siloed process where each application is handled by a single recruiter, we can aggregate and examine specific pathways (particularly those that appear wasteful or don’t reflect organizational norms). Such insights are apt for this application because it allows for a stakeholder to extend beyond the who, and discover when in the process there are bottlenecks, incompliant steps, and wasted effort.
Stage-oriented Data Mining to Improve SLA Performance
Stage-oriented process maps are useful by default in the above example; however, they shine as well for operations that have clearly defined such stages and intend to measure performance against the timely completion of these steps.
In one such case, CKM analyzed the AML process for a large financial institution. The client had clearly defined stages with respective SLAs on their completion and they were particularly concerned with accurately representing the flow of work through these stages. Naturally, the stage-oriented view proved to be the most mutually understood representation of their work completion; however, the most salient process inefficiencies were not apparent in the flow between stages. Rather, bottlenecking occurred within and across these stages as individual work items would pile up with internal squads and teams that were tasked with resolving non-standard requests for our client’s customers. Ultimately, the team chose to present a composite process map that included both stages and assignment groups. With some clever data manipulation and sensible assumptions, a skilled analyst can compress several dimensions to produce the most valuable and insightful operational view.
To see how CKM tackles process mining challenges in detail, check out our submission to the 2019 BPIC challenge where we’ve included stage-oriented process maps. ( http://icpmconference.org/2019/wp-content/uploads/sites/6/2019/07/BPI-Challenge-Submission-8.pdf )
So, how do you see the dimensions of your workflows?